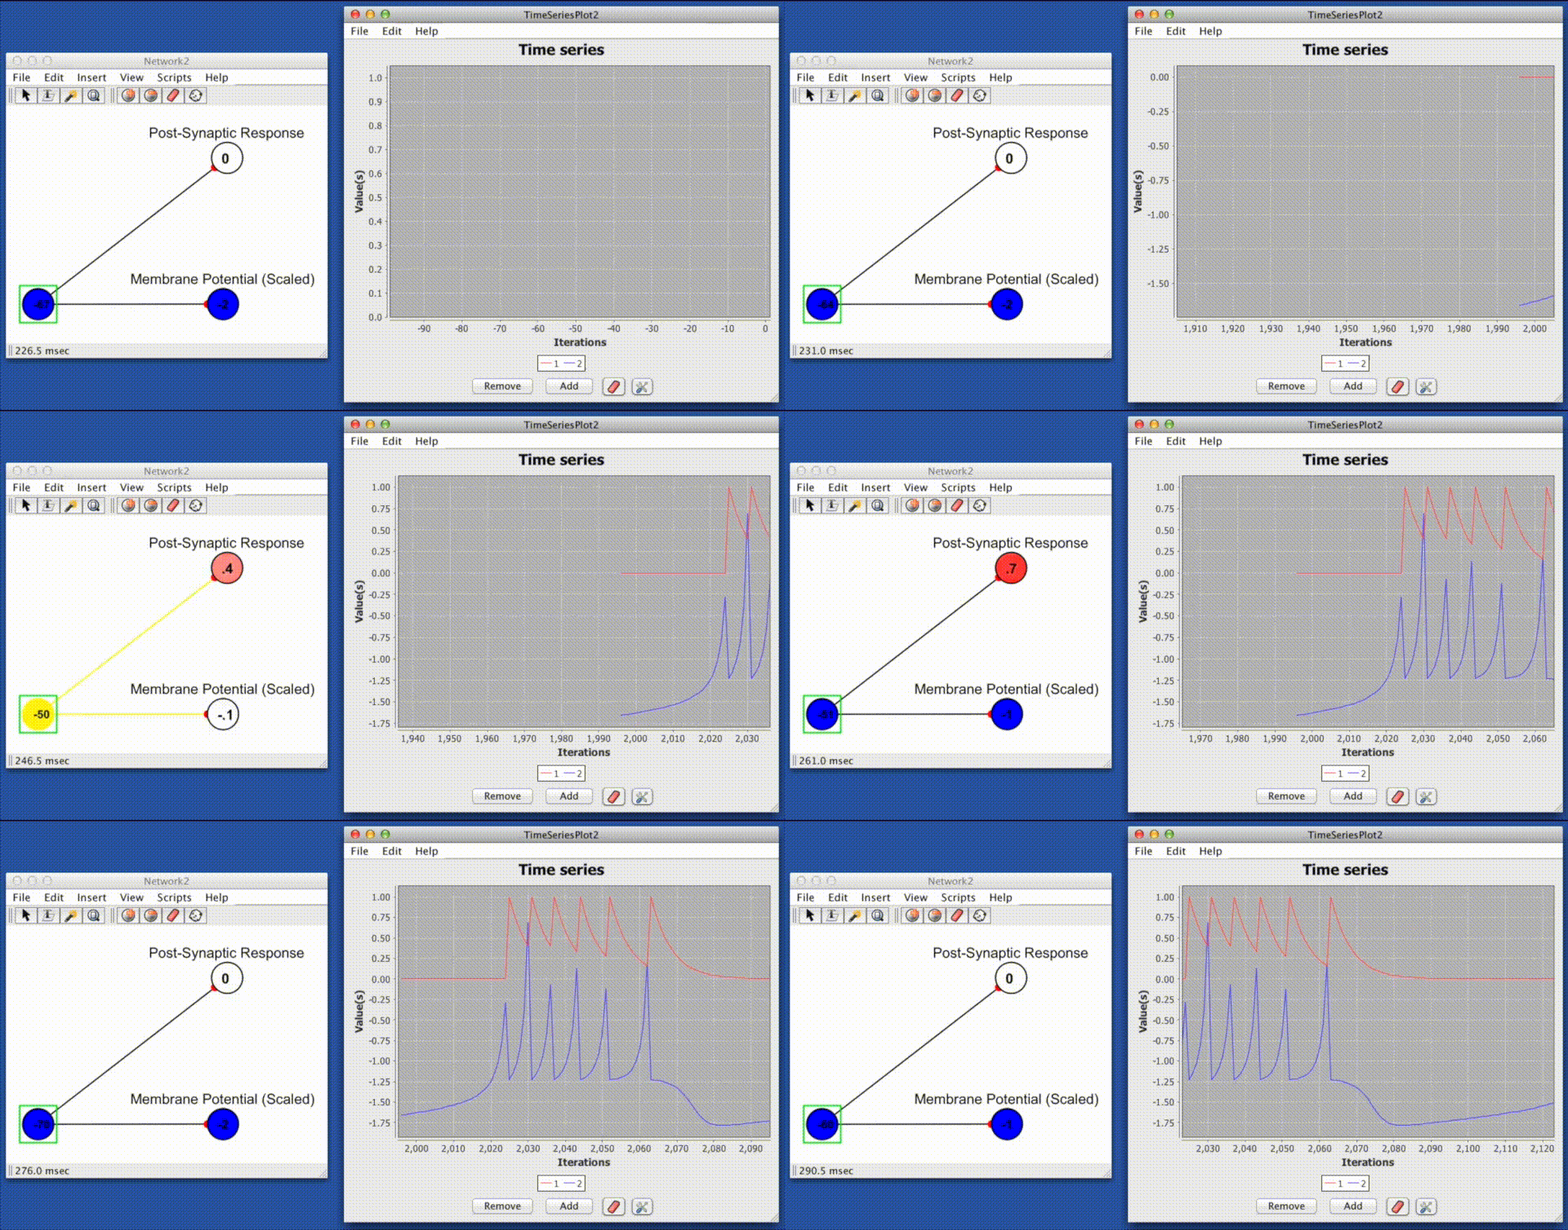
Time Series
Time series plot allows you to track changes in a set of variables over time (time corresponds to simulation time, and is represented on the x-axis of the plot). For example, the spike pattern of a spiking nueron can be viewed by attaching the spiking nueron to a time series plot.

Component Panel
Add: Add a time series to the plot.
Remove: Remove a time series from the plot.
Clear Graph Data: Clears all data from the plot.
Show Graph Properties: Opens up properties menu for the plot.
Menus
File
Open: Opens a time series from a stored .xml file.
Save: Saves the current time series.
Save As: Saves the current time series and allows you to specify a name for the file.
Close: Closes the current time series.
Edit
Preferences: Allows you to set the pie chart's appearance.
Auto Range: When selected, the y-axis is automatically scaled so that the series with the greatest magnitude fits inside the window. It can be useful to turn this off to get a better sense overall changes in magnitude since while it is on they will fill up the window.
Range Lower Bound: Sets the minimum value of the y-axis.
Range Upper Bound: Sets the maximum value of the y-axis.
Fixed Width: When selected, maintains a fixed amount of time points displayed in the plot.
Window Size: Sets the width of the x-axis.
Help
Opens main help page of time series.
Right-Click Menu
The context menu is a JFreeChart menu.