Plot Couplings
Plots must be coupled to other workspace components to do anything interesting. They receive data primarily from neural networks and display updated data at each workspace update.
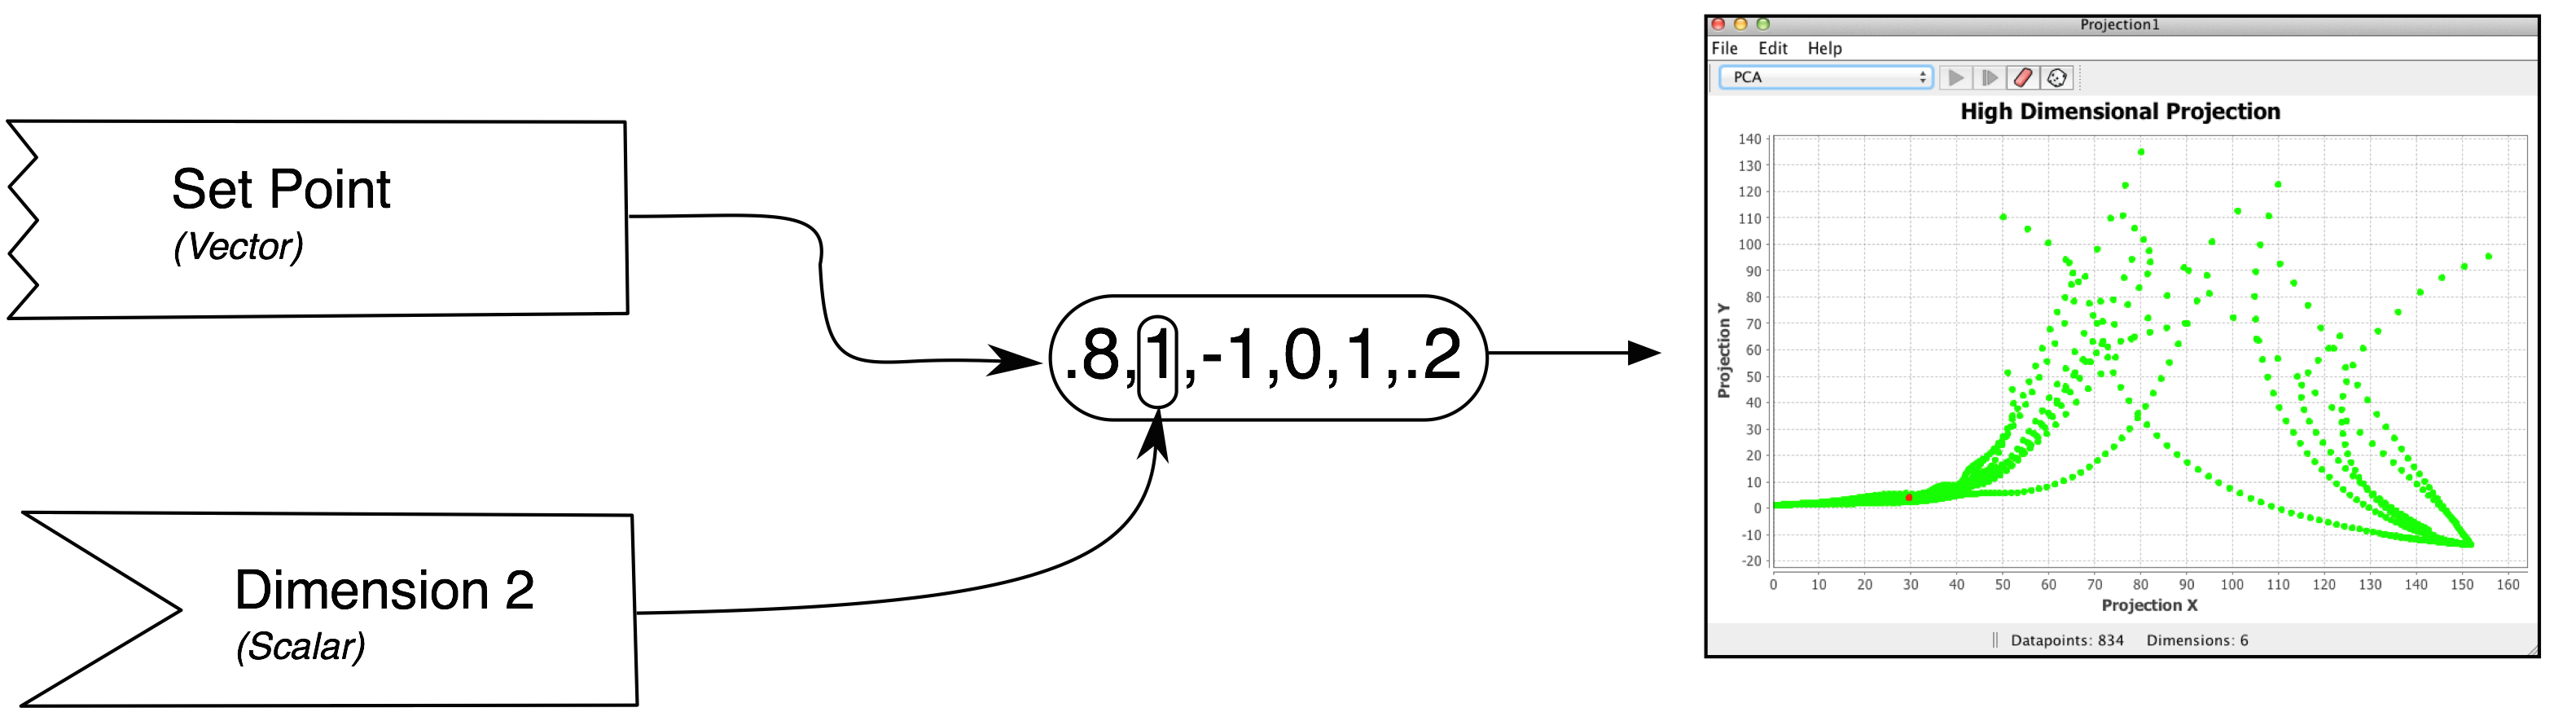
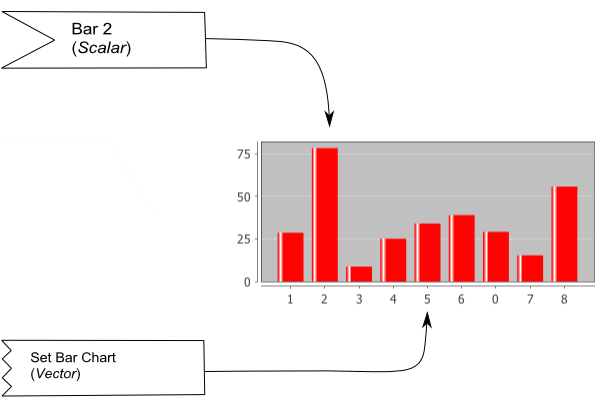
Since they receive data, charts contain consumer attributes. Typically there are scalar consumers which receive data for one bar, "slice" of pie, dimension of an input vector a projection pot, etc. at a time, and vector consumers which receive a complete vector data at each time setp.
The basic ways to couple to plots is similar across cases. Documentation with images has been provided (so far) in two cases, to give a sense of how this works.
Generally you must first set up the chart to accept a certain number of "inputs" from scalar consumers, or to accept vectors of a certain size (number of components) from vector consumers.