Screenshots
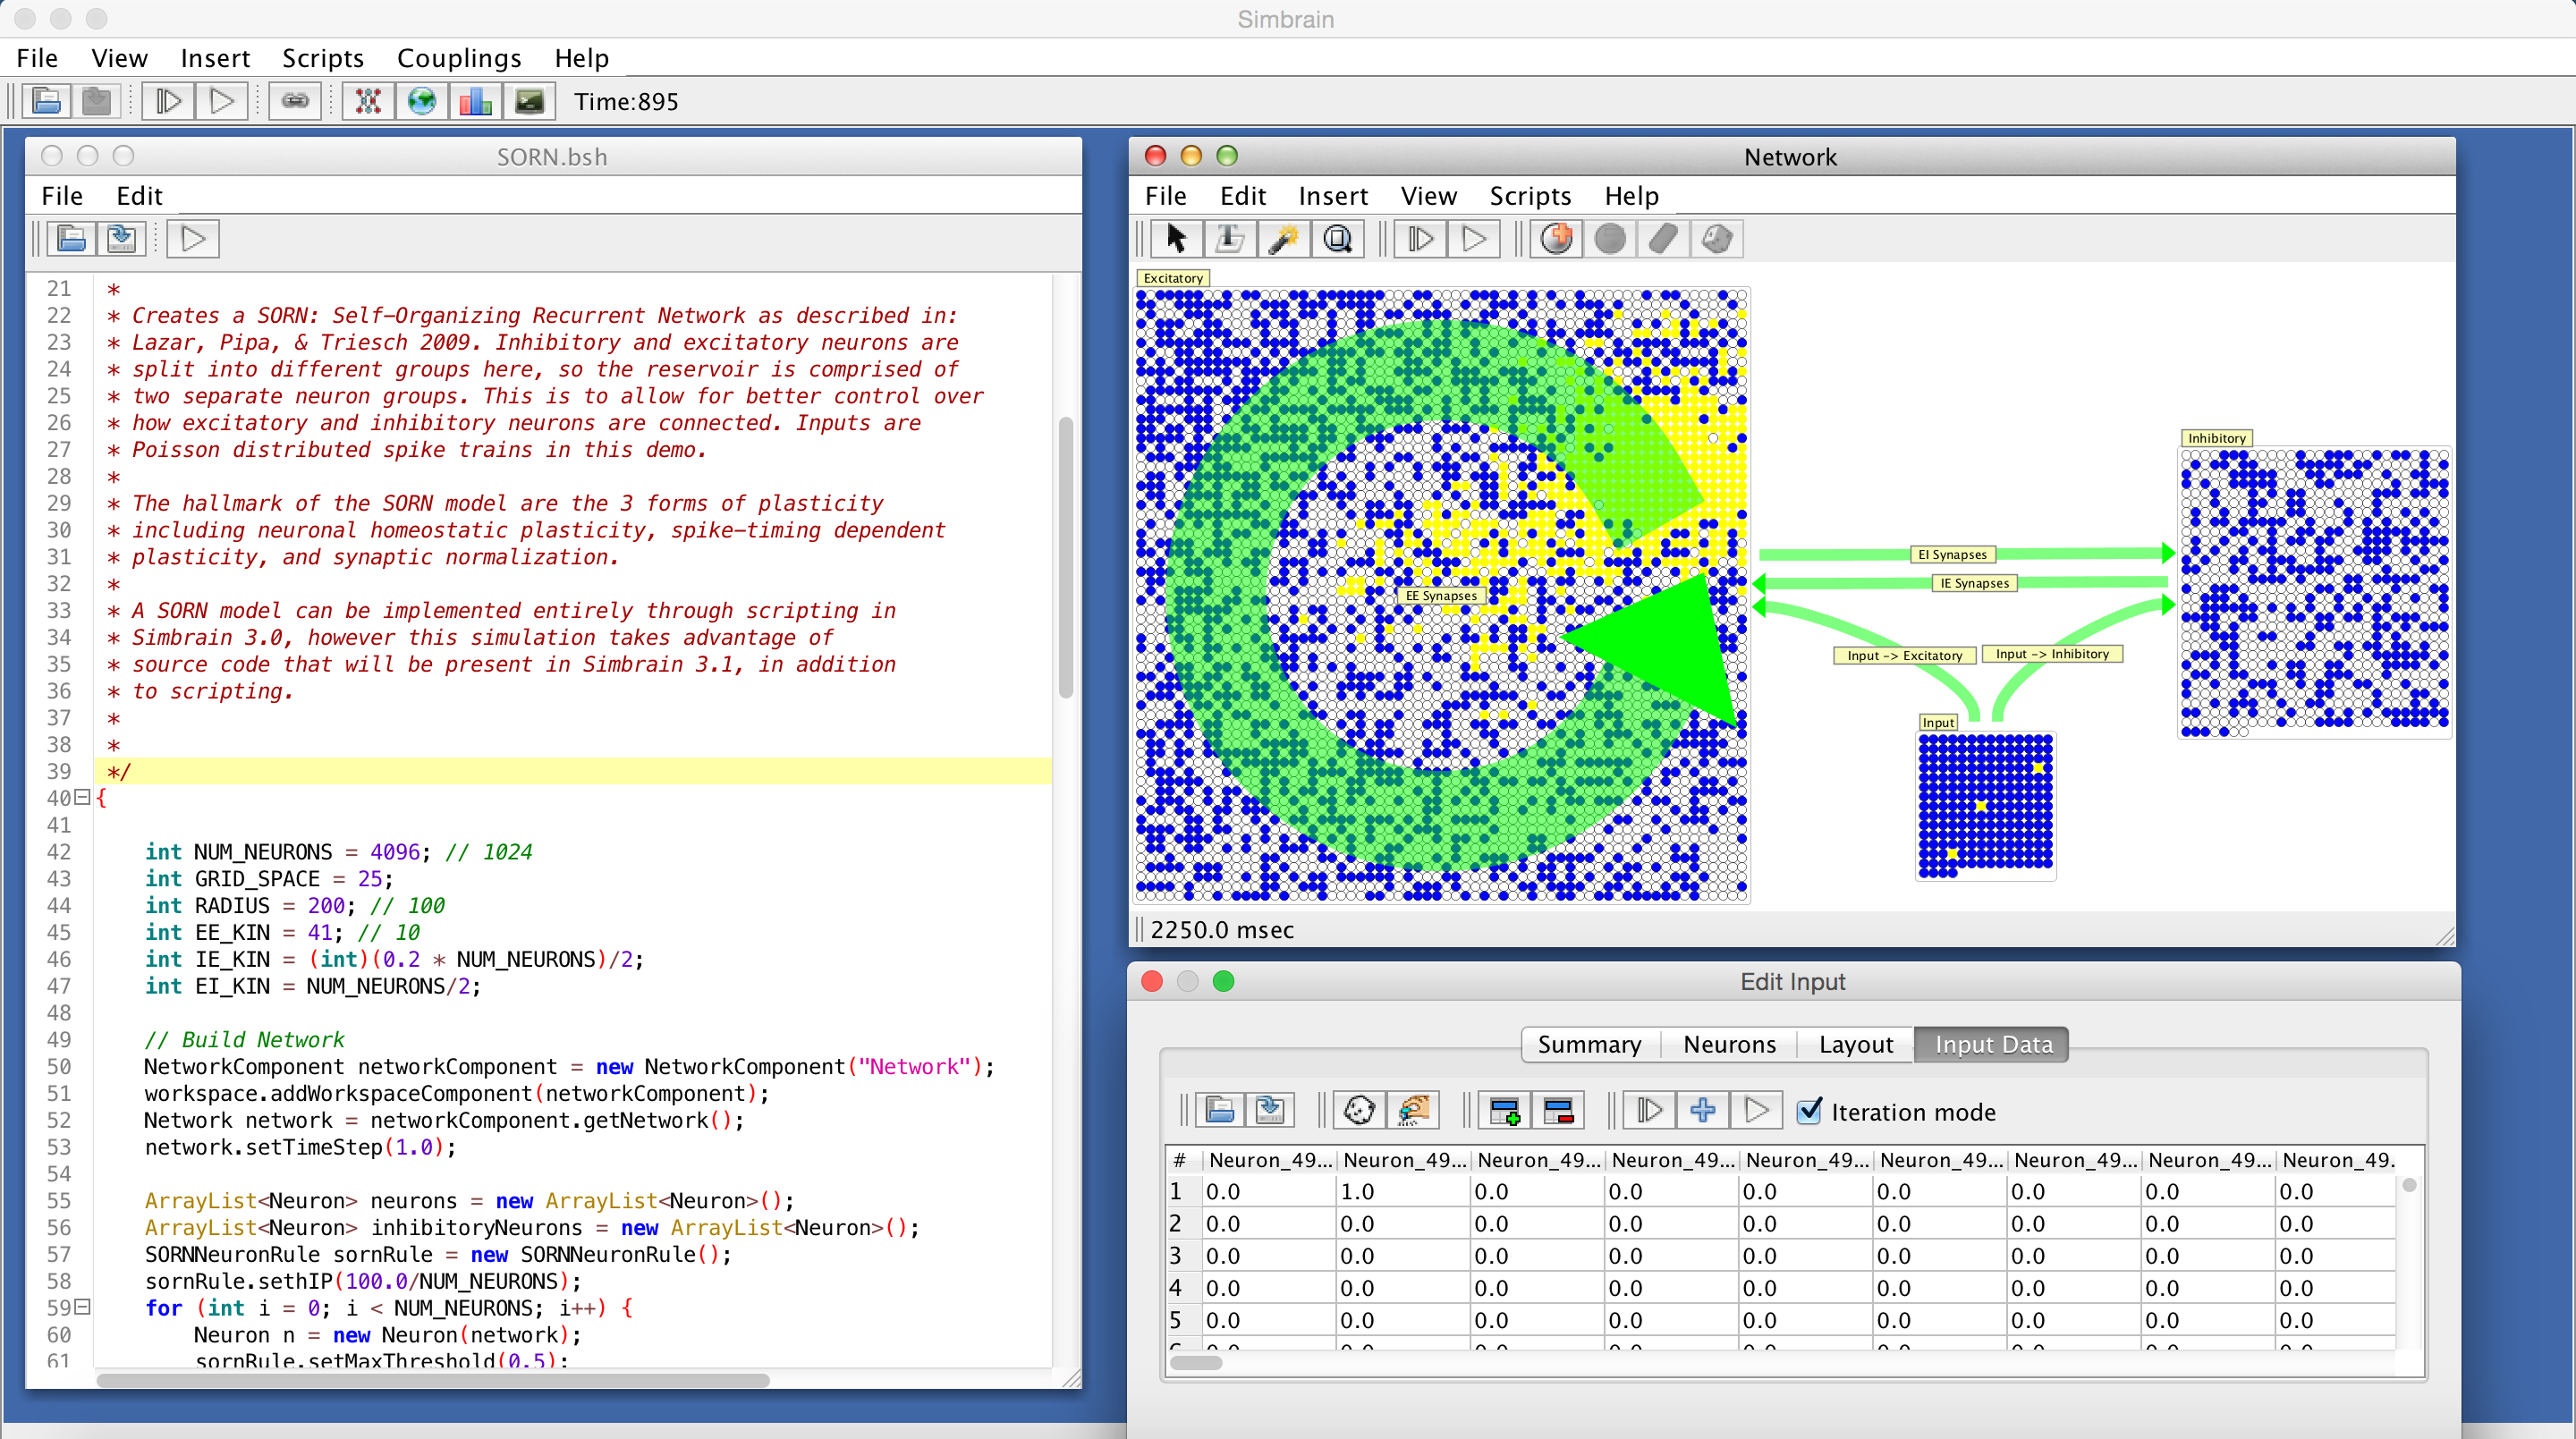
A SORN or Self Organizing Recurrent Network (Lazar, Pipa, & Triesch, 2009). 5115 neurons, 3.6 million synapses, and 3 forms of plasticity. Implemented using a script (not yet available from the GUI).
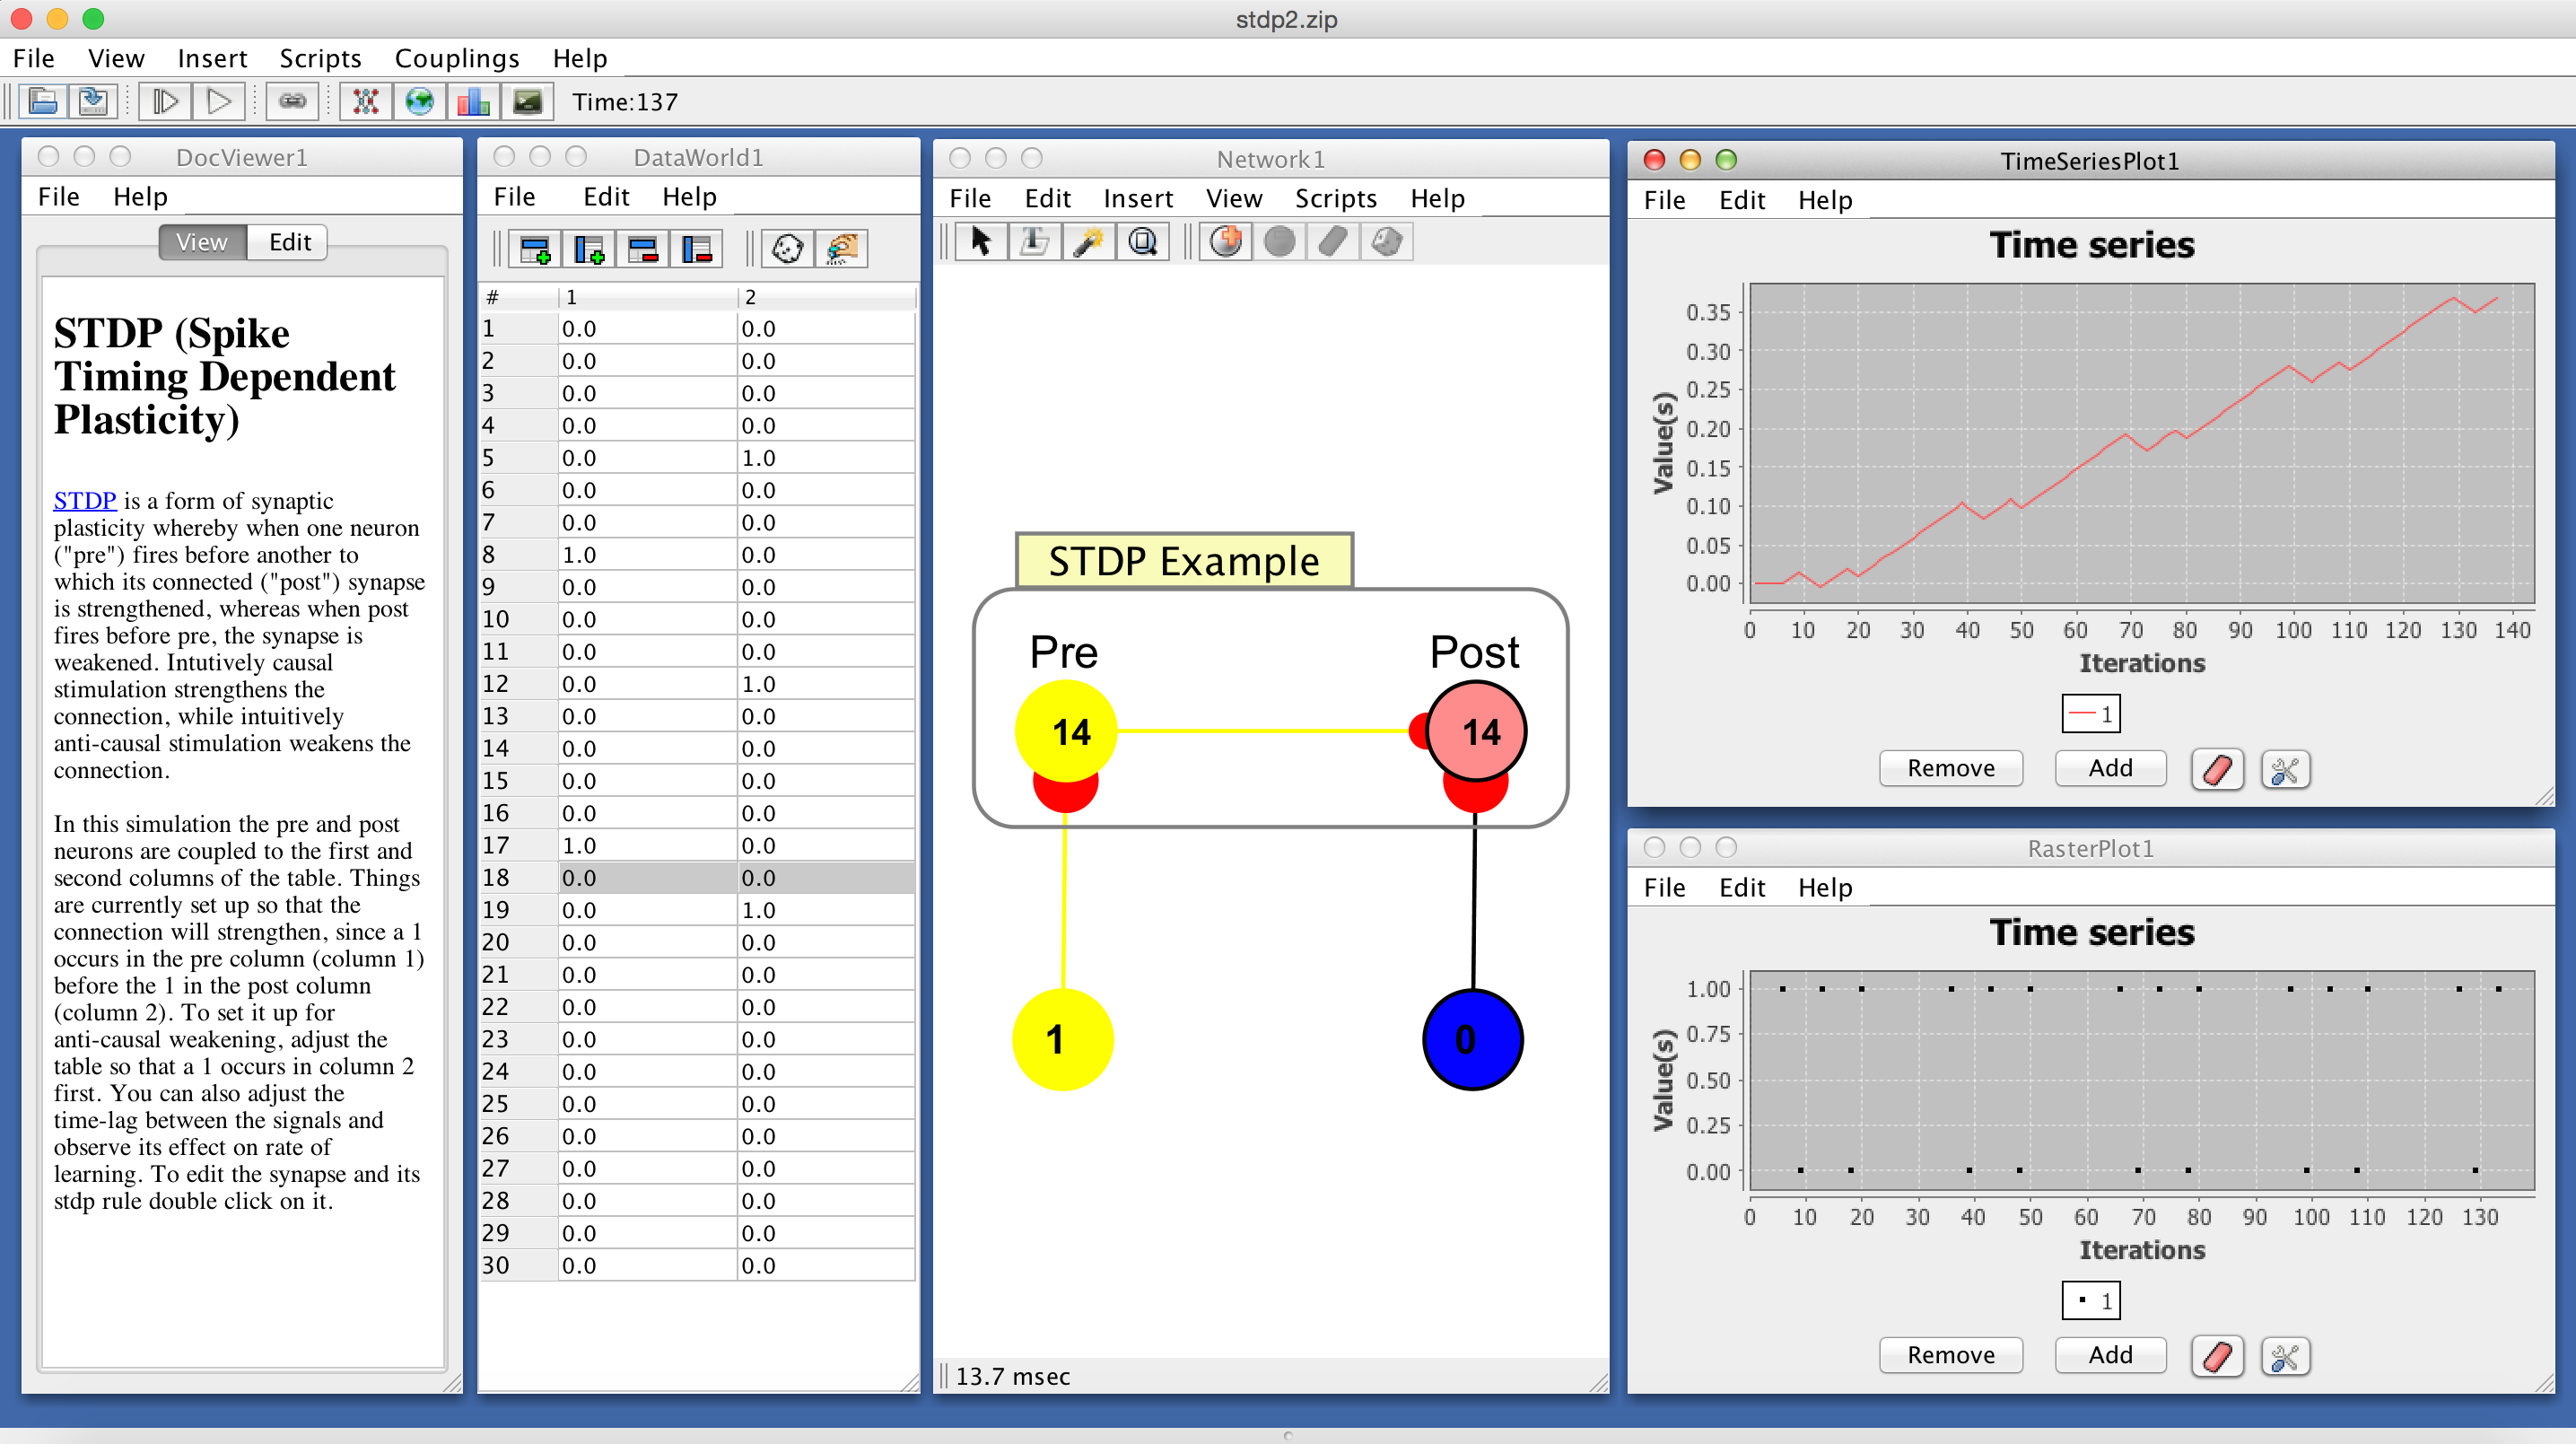
Hebbian STDP. The table is coupled to two individual neurons which drive the neurons on either side of the STDP synapse. The order of activation of the driving neurons can be set in the data table. The case shown potentiates the STDP synapse. A time-series of the synapse's strength and raster of neuron firing patterns are also shown.
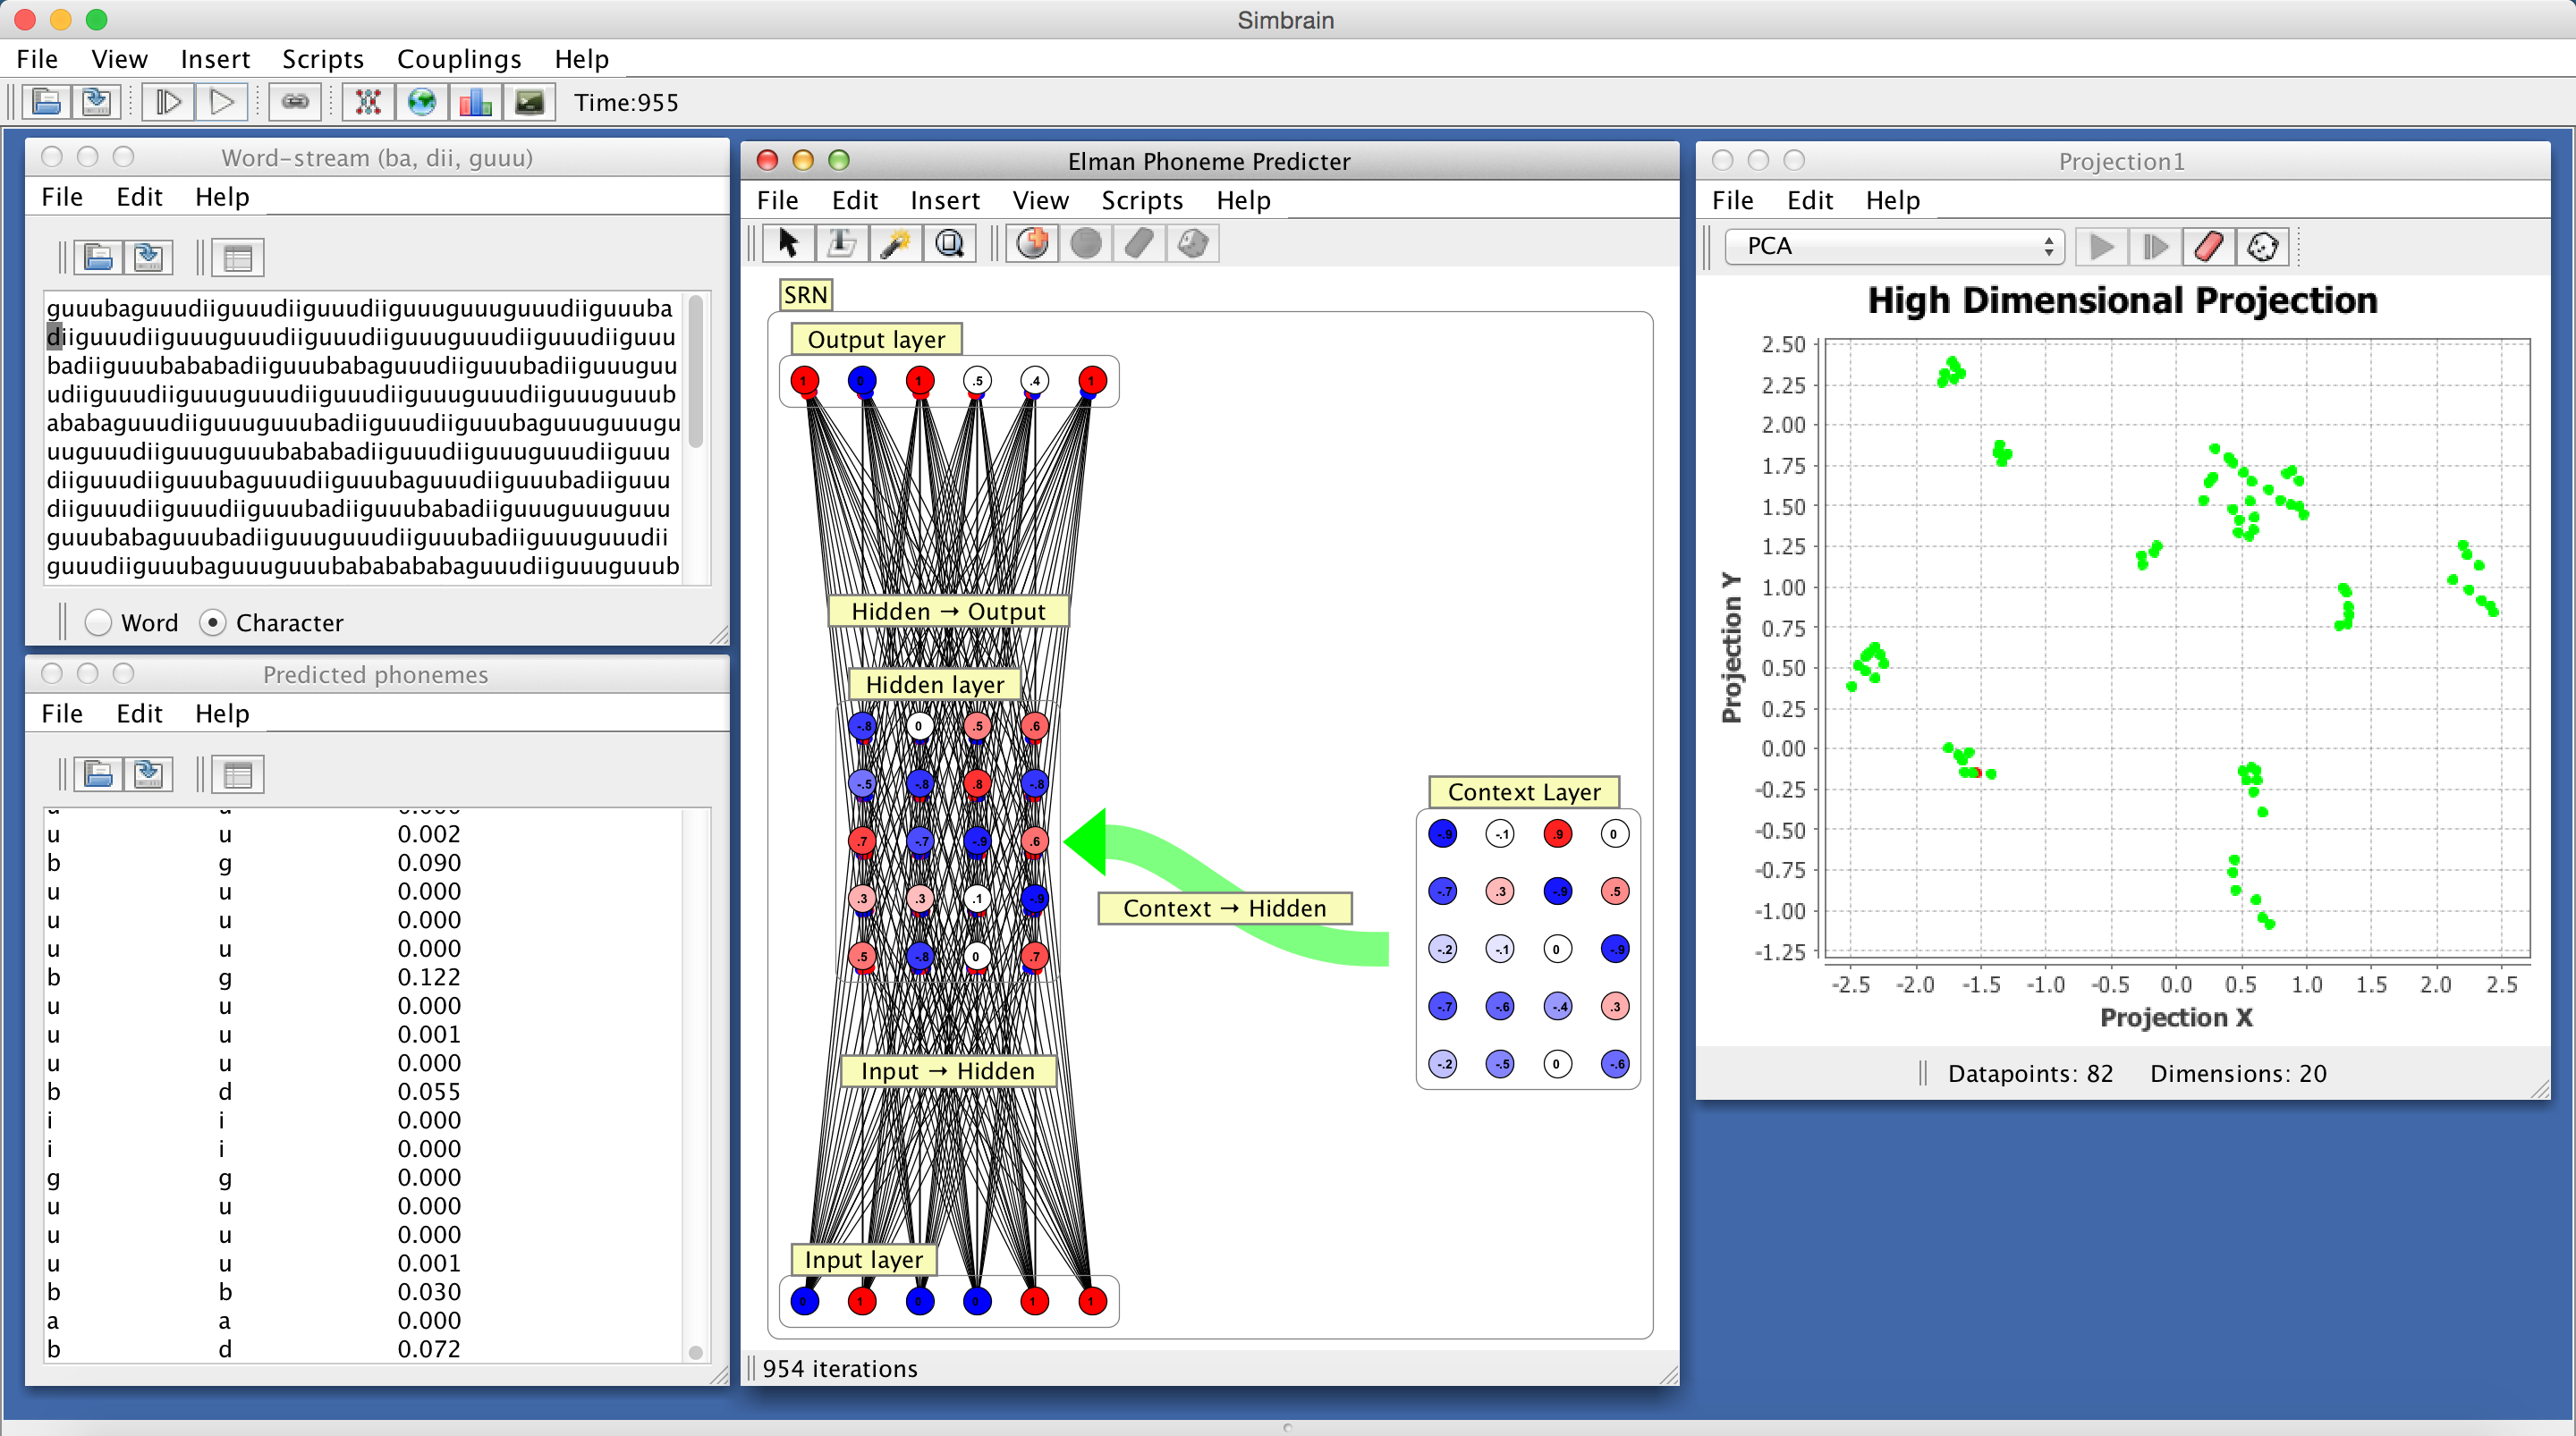
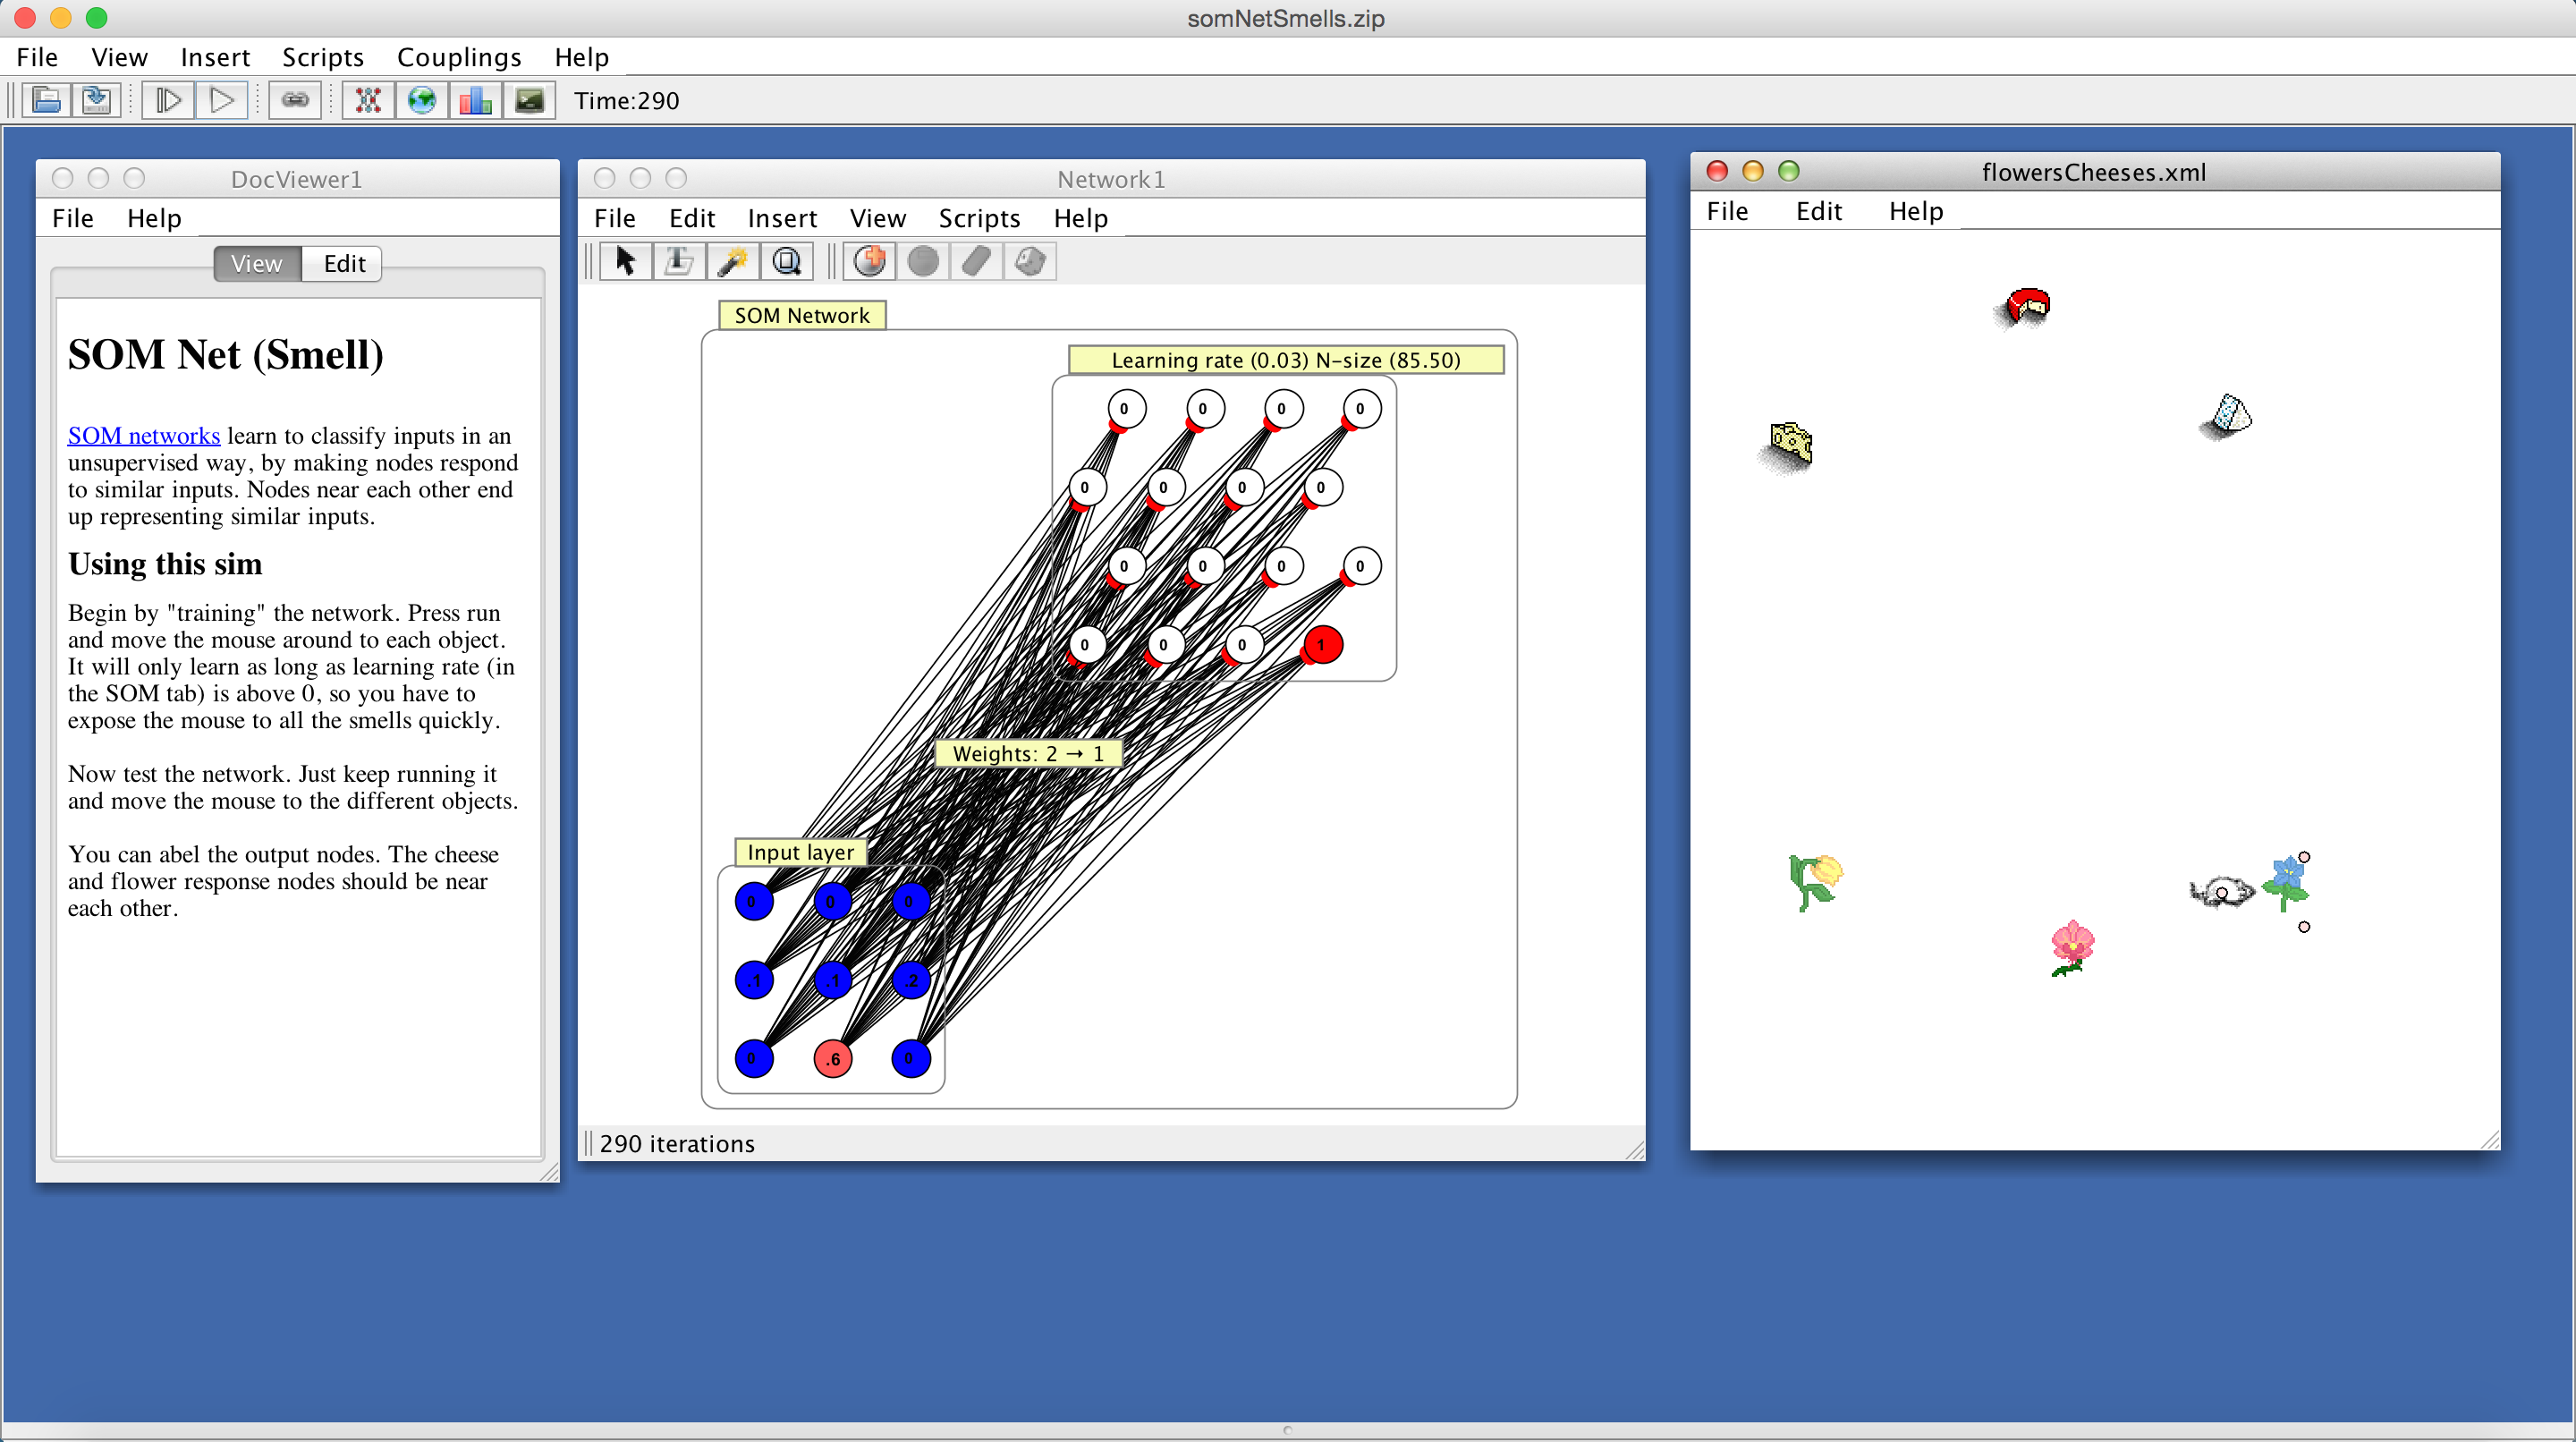
Lexical tokens parsed in a Text World and coupled to the input layer of a simple recurrent network (SRN), which is being trained to anticipate the next phoneme in a training sequence. The data is a sequence of phonemes organized in to three words ("ba","dii", "guu"). The bottom-left panel shows the predicted next phoneme at a time, the actual next phoneme, and error. A PCA projection of activations of the hidden layer is shown on the left. Clusters correspond to characteristic sequences of input text. The network is based on Elman 1990.
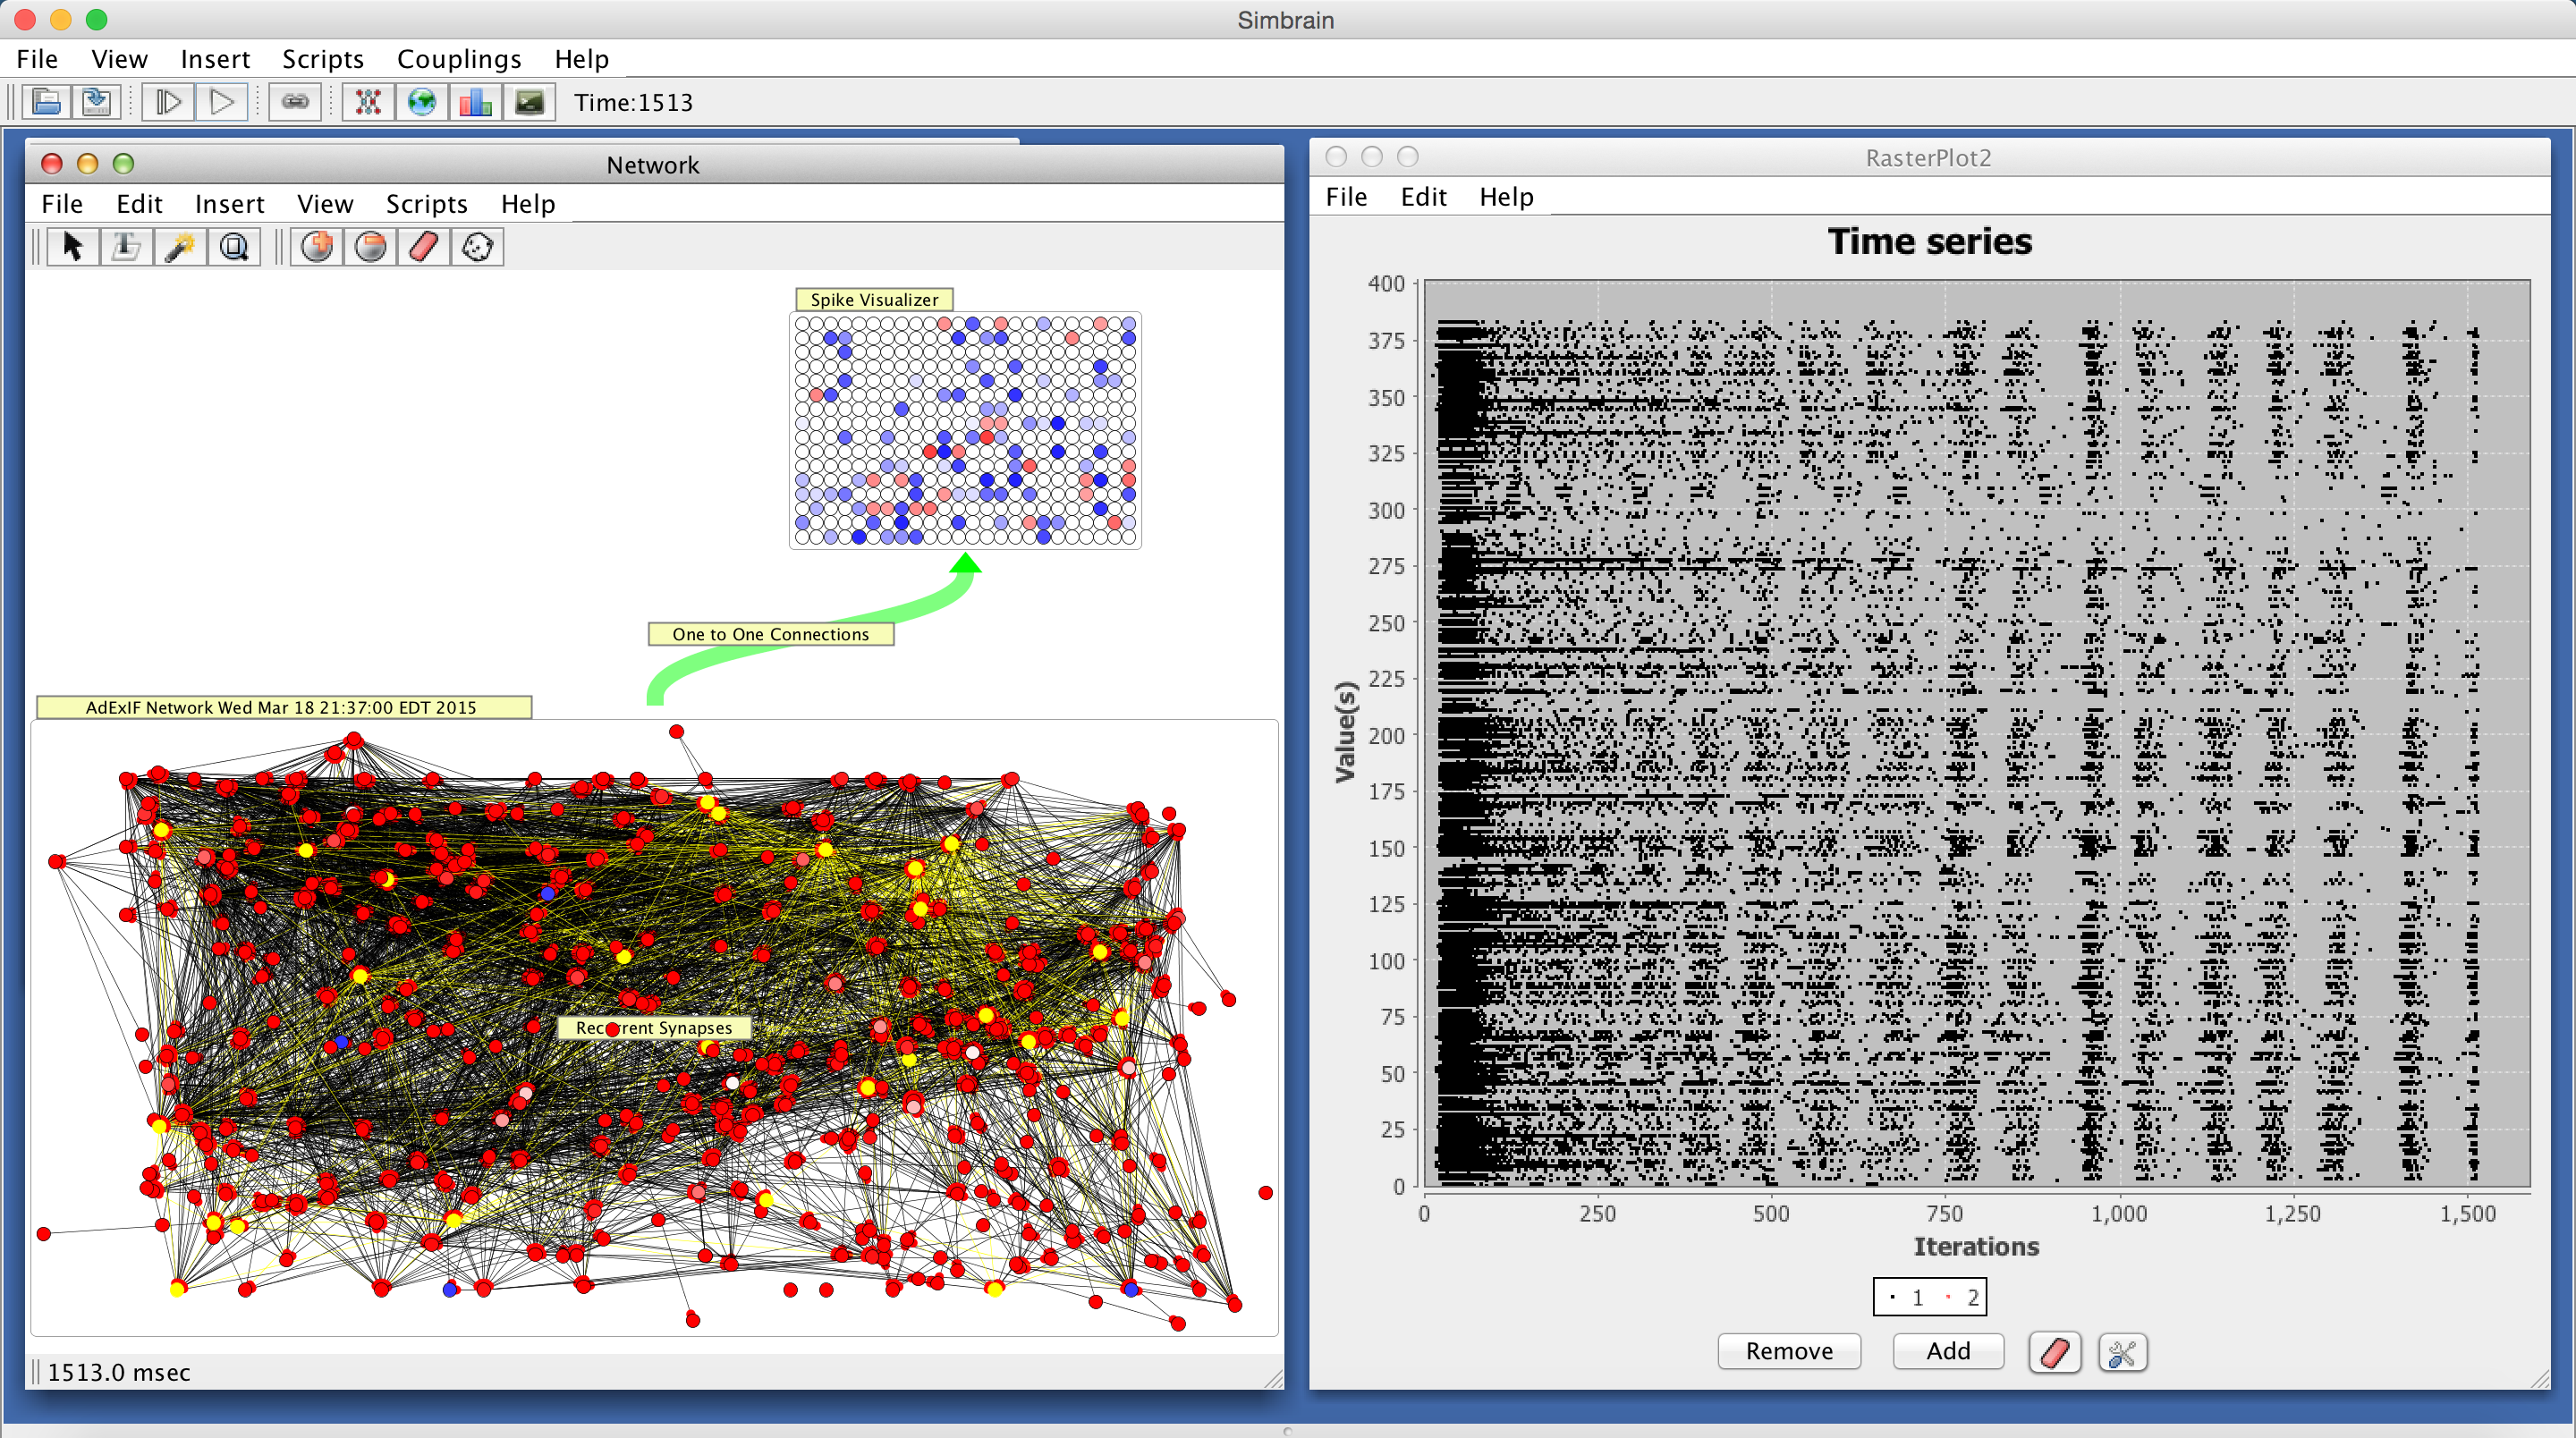
A re-creation of a living neural network, using data recorded from a 512 multi- electrode array. The original living neural network was prepared as a dissociated culture of neurons taken from rat somatosensory cortex. Transfer entropy analysis was performed on the spike trains in the culture to find which neurons had the highest likelihood of being connected by a synapse. The resulting matrix was transformed into a weight matrix and used as the basis for the synaptic connections in the picture. The neuron model used here is the adaptive exponential integrate and fire model. Users can load a weight matrix taken from real neurons as well as their positions and can put that model in Simbrain.
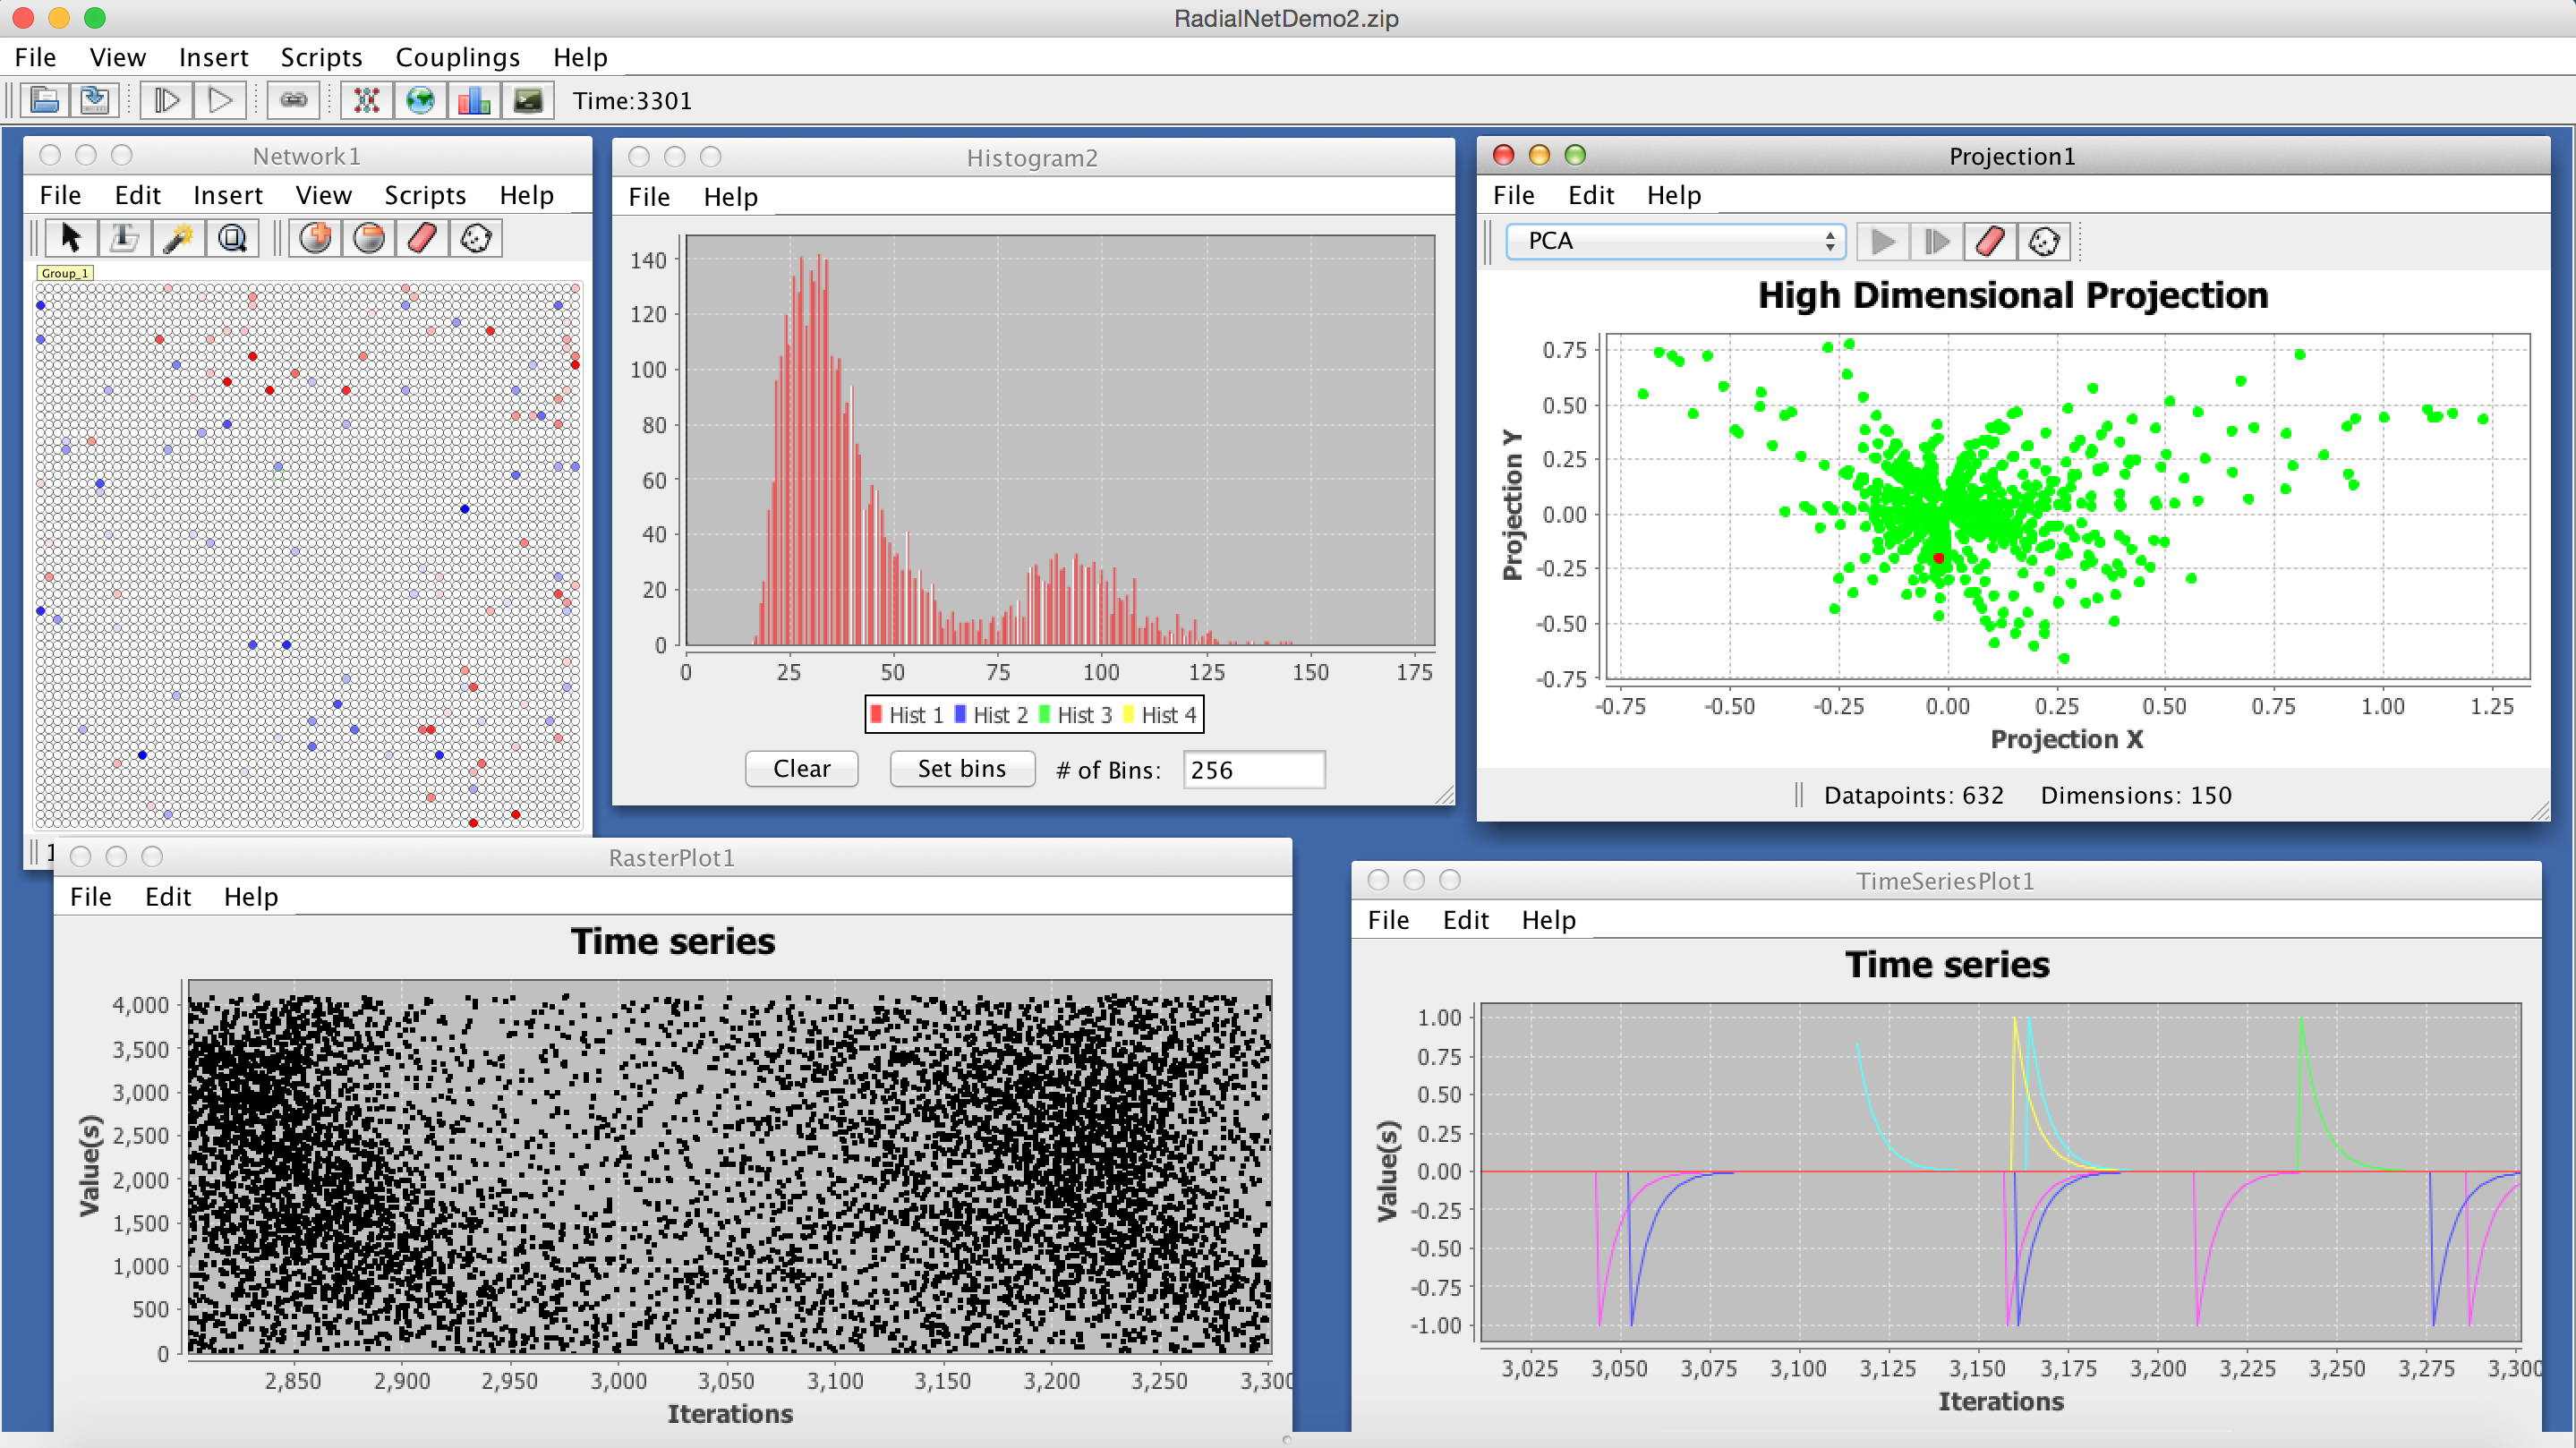
Several visualizers operating at once. Each is coupled to a network (which is running without the GUI). The upper left shows a neuron group coupled to an exponential convolution of its spike trains. This roughly displays how active a neuron has been. The histogram shows how firing rates are distributed across neurons. Low dimension projection using PCA on an exponential convolution of a subsample of the network's spike trains. The raster plot and time series showing an exponential convolution of the spike trains of several randomly selected neurons.
For screenshots of older versions of Simbrain click here.